
The Essence of Leveraged Investing: The Mirror of Mechanical Quants and a Practical Answer for Individuals

Primary sources and simulation limits
Product structure and Korean investor warnings are checked against the Financial Services Commission's official notice. The risk that cumulative results can diverge from a stated daily multiple over longer holding periods is cross-checked with the U.S. SEC's investor statement. The eight results below are simulations using specific data, periods, and tax assumptions—not repeatable future performance. A leveraged product can lose the entire principal.
"Recently, with the rise of single-stock leveraged ETFs, many people have been warning about the dangers of leverage. But is that really the case? Today, we will dig deep into the nature of leverage."
1. The Shadow of Samsung Electronics and SK Hynix Leverage
Recently, intense fear and warnings have emerged among investors regarding the newly listed single-stock leveraged ETFs for Samsung Electronics and SK Hynix in the Korean stock market. Contrary to expectations of making big profits by riding the semiconductor cycle, investors experienced their accounts rapidly melting away when they encountered a "sideways market," where stock prices fluctuated up and down without a clear direction.
Korean financial authorities classify single-stock leveraged products as high risk and apply safeguards such as advanced education, a minimum deposit, and clearer product labeling. Because later overheating measures and implementation dates can change, readers should verify the latest official notice.
In fact, any investor who endured a massive secular bear market like in 2022 would have felt bone-chilling fear at this bizarre phenomenon where an account gets eaten away just by a sideways-moving stock price. This phenomenon, known as 'Volatility Drag' (or negative compounding), is a mathematical destiny inherent not only to single-stock leverage but to all leveraged ETFs like TQQQ. So, is leverage inherently evil, or is the problem that we approach it like a magic lamp without properly understanding its mathematical backbone?
To help readers intuitively understand, I will explain the framework of leverage using QQQ, the most famous 1x Nasdaq ETF in the world, and TQQQ, its 3x leveraged counterpart.
2. The Reality of Leveraged ETFs: The Quant's Mirror
Before getting into the main content, let's go over some key concepts that will appear in this text.
- Exposure: The total size of capital exposed to market price fluctuation risks. For instance, if you bought a 3x leveraged ETF with a principal of 10 million KRW, your principal is 10 million, but you have the same exposure as holding 30 million KRW worth of stocks in the market.
- Daily Reset: Leveraged ETFs settle their accounts on a daily (1-day) basis to exactly match this '3x exposure.'
Many investors mistakenly believe that the risk of leverage simply comes from 'using debt (loans)'. However, the true detonator (Risk) embedded in leveraged ETFs lies not in the debt itself, but in the 'Exposure Rebalancing' that is forced every single day during this daily reset process.
To understand how leveraged products work, you only need to remember this one proposition:
"Leveraged ETFs are the exact replica of quant strategies that buy more when it goes up and sell more when it goes down."
A leveraged ETF is not a product where you simply bury 3 times your principal in stocks and leave it alone. For example, suppose the underlying asset goes up by 10% in a single day. To match the target exposure for the next day proportionally to the increased asset value, the 3x ETF must purchase additional derivatives at the higher price near the market close (chase buying) to pull up its exposure. Conversely, if the underlying asset drops by 10%, the ETF must mechanically sell off a large amount of assets at the lower price (forced liquidation) to reduce the now excessively large exposure back down to 3x relative to its shrunken asset base.
Like this, the extreme Trend Following (Momentum) behavior of buying high when the market rises and selling low when it falls is repeated infinitely every day. These massive funds pour in right before the market close every day to adjust exposure, further amplifying the upside and downside swings of the underlying stocks. On top of this, the institutional interest on the massive Margin Debt internally borrowed by the fund to meet exposure and derivative swap fees are added, gnawing away at the fund's value day by day.
The Positive Function of Leverage from a Market Perspective: Price Discovery and Efficiency
If these leveraged products blindly chase momentum while eating up fees and interest, why do they even exist, and what beneficial role do they play from a macroeconomic market perspective?
The core lies in 'accelerating Price Discovery' and 'increasing Market Efficiency'. Without leveraged capital, when strong positive or negative news hits the market, the speed at which stock prices move to find their new 'Fundamental Value' becomes sluggish. If prices move slowly, many individual investors who lack information and have slow reaction times are at a high risk of entering at a 'wrong intermediate price' that hasn't found its place yet, only to suffer massive losses later.
Leverage allows investors to bet on strong convictions (directionality) with less capital. When this massive leveraged capital is mechanically injected into the market near the close, stock prices reach the true value implied by news and market conditions in an instant. In other words, by quickly finding its efficient place, the price actually performs a powerful market purifying action that prevents the masses from getting trapped at awkward prices.
Ultimately, leveraged products are an essential cogwheel for the health of the overall market. However, for an individual investor who jumps onto this massive cogwheel without a macroeconomic strategy, the following harsh mathematical costs are billed.
3. Volatility Drag and the Truth of Hidden Costs
The biggest enemy of leverage is the 'Volatility Drag' originating from the daily reset described earlier. Even if stock prices simply fluctuate sideways, the structural flaw where the principal is slowly chipped away through the repeated process of buying high and selling low every day remains.
Furthermore, to visually confirm the actual negative impact of the 'swap interest and fees' internally paid by TQQQ, we virtually back-tested a 'Self-Leverage' strategy based on the 1x QQQ.
- Self-Leverage: To avoid paying massive fees or loan interest to ETF management companies, this is a virtual simulation strategy where you initially buy a full 3x exposure worth of 1x (QQQ) using your own capital, and then manually buy and sell every day at the market close to mimic the exact exposure of TQQQ.
Including this self-leverage backtest result, let's compare the asset trends of the following four cases over exactly the past 1,200 trading days (October 5, 2021 ~ July 2026), a period that experienced both secular bull and bear markets. (① QQQ 10M KRW, ② TQQQ 10M KRW, ③ QQQ 30M KRW, ④ Self-Leverage)
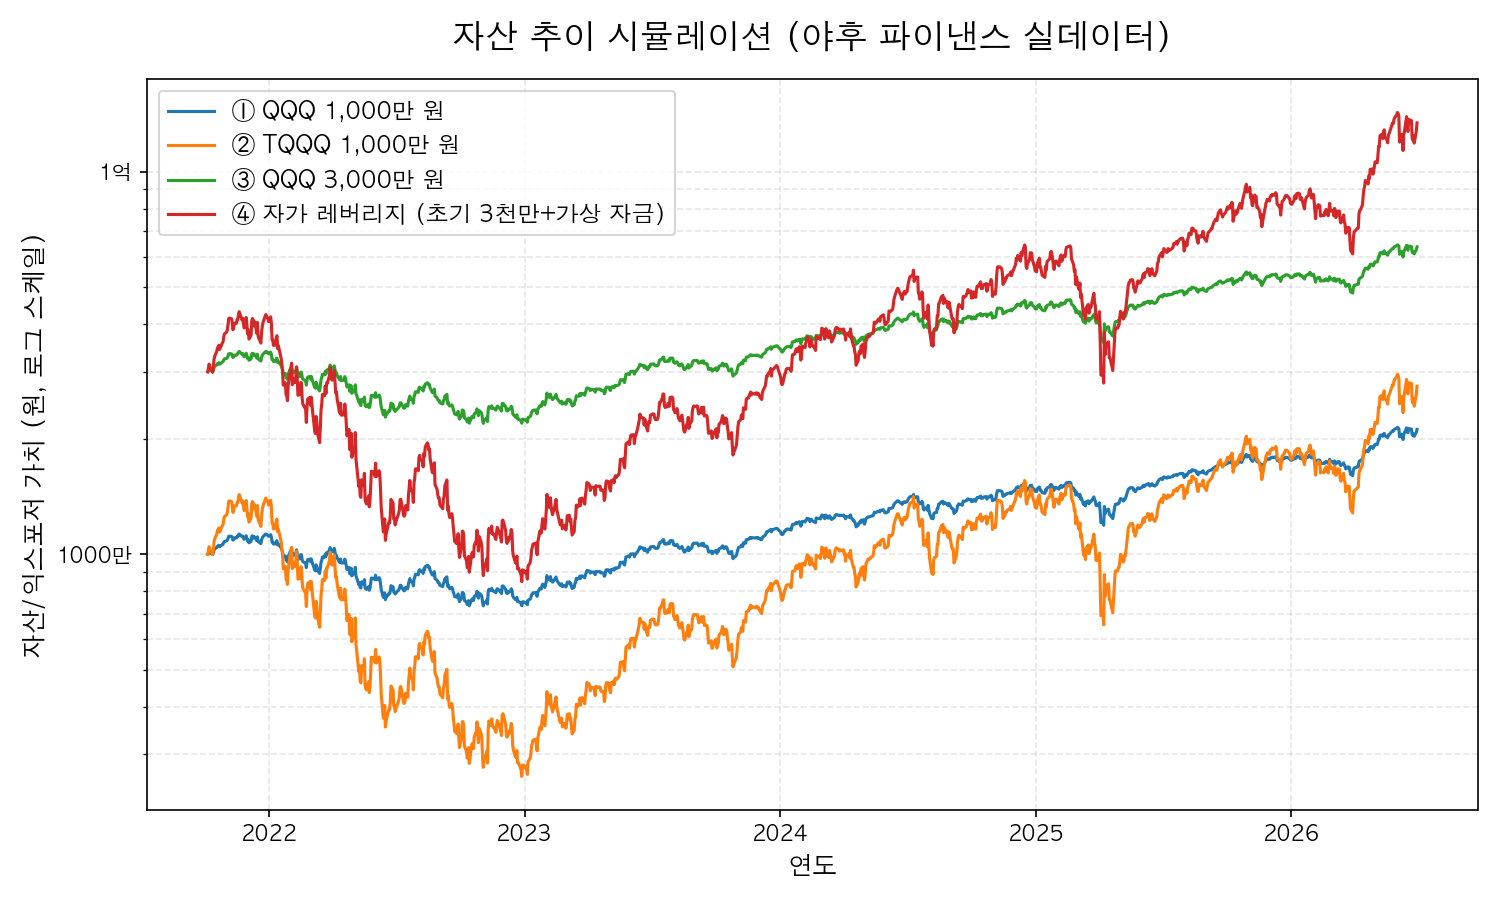
[Table] Summary of Simulation Results (Based on 1,200 Trading Days: Oct 5, 21 ~ Jul 1, 26, Yahoo Finance Real Data)
Note: Oct 5, '21 TQQQ $29.45 / QQQ $347.22 → Jul '26 Current TQQQ $81.00 / QQQ $736.40 (Reflecting actual closing prices)
| Investment Strategy | Starting Amount | Added Amount | Total Invested Amount | Final Amount | Profit | Return on Investment (ROI) |
|---|---|---|---|---|---|---|
| ① QQQ (1x) | 10M KRW | 0 KRW | 10M KRW | Approx. 21.21M KRW | +11.21M KRW | +112.1% |
| ② TQQQ (3x ETF) | 10M KRW | 0 KRW | 10M KRW | Approx. 27.50M KRW | +17.50M KRW | +175.0% |
| ③ QQQ (1x) | 30M KRW | 0 KRW | 30M KRW | Approx. 63.63M KRW | +33.63M KRW | +112.1% |
| ④ Self-Leverage | 30M KRW | Approx. 69.46M KRW | Approx. 99.46M KRW | Approx. 134.19M KRW | +34.73M KRW | +34.9% |
The results are quite shocking. TQQQ rose from $29.45 to $81.00, generating a profit of +175.0%. However, considering that the 1x QQQ rose from $347 to $736, a +112.1% increase, this falls far short of the '3 times (+336%)' return we expected. While QQQ more than doubled, TQQQ only rose by about 1.5 times the return of the 1x. This phenomenon where volatility fluctuates even in a bull market and eats away at the return rate is the true, terrifying reality of 'Volatility Drag'.
Here, a more shocking hidden cost appears. Self-Leverage (④) and TQQQ (②) were designed to move exactly the same at a 3x multiple, so why did a massive difference of about 17.23 million KRW (34.73M - 17.50M) occur in the profit?
This difference is exactly the sum of the 'swap interest' and 'ETF management fees' secretly paid by TQQQ. To match the 3x exposure, TQQQ management companies secretly take out massive debt (Margin Debt) from banks to buy derivatives. While you felt safe thinking you hadn't taken on debt directly, expensive loan interest rates and rollover costs were already being deducted from your Net Asset Value (NAV) every single day inside the fund.
This concludes the explanation of the violence and hidden costs of general leveraged ETFs. Then, what if we run 'Self-Leverage' with the exact same strategy like number ④ in the table above? It seems perfect since you can take all the net profit without having to pay interest or fees.
But look at the table again. Every time the market fluctuates, you must maintain your 3x exposure exactly. If the exposure is lacking, you not only have to continuously pour in your own hard cash (added amount approx. 69.46 million KRW) fluidly, but conversely, when the market drops and you need to reduce exposure, you must mechanically execute sales even if you don't want to. The frequent trading that occurs every day in this process inevitably causes massive brokerage transaction fees and capital gains tax issues to snowball.
Can an ordinary individual, without the help of advanced automated trading systems or financial products, flawlessly execute this mechanical 'daily reset'—staring at the order book every night before and after market hours while enduring the bleeding of taxes and fees—for the rest of their life? This is the limit of leverage strategies that are perfect in theory but impossible to execute in reality.
4. The Principle of Rebalancing and the Terror of Forced Liquidation
In Chapter 3, we confirmed the hidden costs (interest, fees) of TQQQ. Then, what exactly is the principle of the 'daily reset (rebalancing)' that leveraged ETFs mechanically perform every day? Assuming the underlying asset drops by 10%, it can be summarized in the following 4 steps.
- Asset Evaluation: Due to the drop in the underlying asset, your principal (Equity) is significantly reduced.
- Target Calculation: Based on your reduced principal, the '3x target exposure amount' to maintain for the next day is recalculated.
- Forced Sell (Bear Market): Stocks exceeding the target are forcibly sold at a loss at the bottom. This is where 'negative compounding' occurs.
- Chase Buy (Bull Market): Conversely, when the market rises, you take on more debt to chase-buy stocks at the peak.
We conducted a thought experiment where we unlocked the shackles of this forced selling (Step 3) and directly mimicked the exposure changes of TQQQ by injecting 'virtual additional funds' from a pure principal state with zero brokerage loans (debt).
- ⑤ Asymmetrical Exposure (Upside Tracking): Starting with 30 million KRW (1x), this strategy injects a virtual fund of the exact same amount to grow the size only when TQQQ buys stocks (bull market), and leaves it alone without stop-loss selling during bear markets.
- ⑥ 30M KRW Defense (Fixed Lower Bound): Regardless of TQQQ, this strategy injects virtual funds only when your exposure drops below the initial value of 30 million KRW, defending the downside at a fixed 30 million KRW.
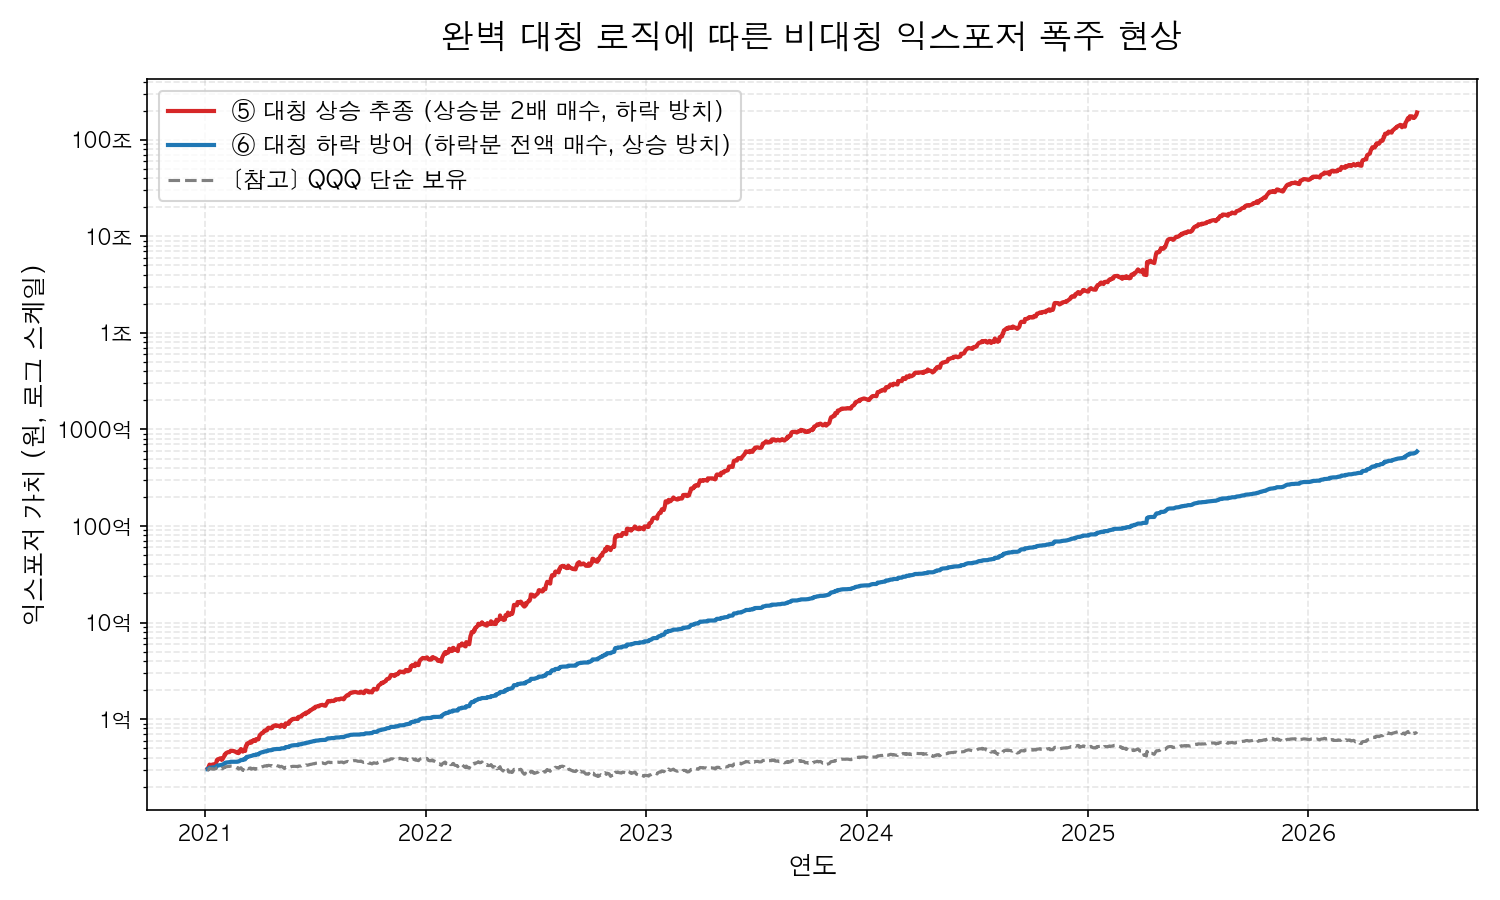
[Table] Symmetrical Logic-Based Simulation Results (Actual QQQ Data)
| Investment Strategy | Starting Amount | Virtual Fund Injected | Total Invested Amount | Final Amount | Profit | Return on Investment (ROI) |
|---|---|---|---|---|---|---|
| ⑤ Symmetrical Upside Tracking (Asymmetrical) | 30M KRW | Approx. 169.6353 Trillion KRW | Approx. 169.6354 Trillion KRW | Approx. 191.8311 Trillion KRW | +22.1957 Trillion KRW | +13.1% |
| ⑥ Symmetrical Downside Defense (Asymmetrical) | 30M KRW | Approx. 44.6901 Billion KRW | Approx. 44.7201 Billion KRW | Approx. 59.1343 Billion KRW | +14.4142 Billion KRW | +32.2% |
Result Interpretation: The 'Cash Black Hole' as the Price for Chasing the Sweetness of Asymmetry
- The Catastrophe of Symmetrical Upside Tracking (⑤): This is the result of perfectly mimicking a 3x compound by maintaining a massive exposure size without stop-loss selling in a bear market, and unconditionally pouring in '2x the rising amount' with hard cash proportionally to that massive size in a bull market. Because the size never shrinks, the compounding goes out of control, swelling the size of your account to 191 trillion KRW after 1,200 days. Since even a 1% rise in this size requires pouring in trillions of won, it ultimately became a fictional strategy that is only maintainable by pouring in a national budget-level virtual fund of 169 trillion KRW. (Final ROI only +13.1%)
- The Catastrophe of Symmetrical Downside Defense (⑥): Leaving it alone when it goes up, and defending the 'previous day's exposure' perfectly by filling in exactly the amount shaved off yesterday with hard cash when it goes down. Since all drops are blocked, the asset hits an all-time high every day, rocketing up to 59.1 billion KRW. However, since you have to fill in hundreds of millions or billions of won every time this massive size faces a bear market (-1%, -3%), a crazy maintenance cost of 44.6 billion KRW gets sucked in.
Under this simulation's price path and rules, continuously offsetting one side of "reduce exposure after declines, increase exposure after gains" with outside cash caused the required funding to grow rapidly. It is an example of why an asymmetrical defense needs a cash-capacity test, not a general proof for every market path.
5. The Emergence and Limits of Practical Alternatives (La-O-Er Infinite Buy Method and VR)
The preceding simulations highlighted two risks that leveraged investors need to examine.
- Accepting Volatility Drag: If you follow the rules and sell when it falls and chase-buy when it rises, your account melts away exponentially in a volatile market.
- Cash Black Hole (Asymmetrical Defense): If you try to avoid this by breaking the rules and defending drops with hard cash, compounding goes out of control, and you can only survive by pouring in tens of billions or hundreds of trillions of won in virtual funds.
To overcome this 'cash black hole' problem, practical variant strategies emerged among individual investors in Korea that attempt to control cash by forcibly limiting the period and number of purchases. The most representative of these is the investment method by Korean investor 'La-O-Er'.
The Core Logic and Shining Practical Value of the La-O-Er Method
- Infinite Buy Method: This Korean retail-investor method divides total capital into 40 parts, limits the period and number of purchases to roughly 40 trading days, and buys mechanically each day. When the total account return reaches +10%, the position is sold and a new cycle begins.
- Value Rebalancing (VR): Borrowing the 'Value Averaging' theory described later, but to prevent fees from frequent daily trading, a gap (Band, e.g., 80%~120%) is set above and below a target baseline. If it breaks through the bottom, you pour in cash to buy; if it breaks through the top, you sell stocks to cut it down to the target figure.
In that it controlled shallow human fear and greed, and made the contrarian approach of 'selling high and buying low' mechanically actionable in a real account, this method holds immense practical value in the Korean leveraged investing ecosystem.
Structural Limits (Drawbacks) of the La-O-Er Method
However, these practical strategies, optimized for sideways or gentle bull markets, also reveal painful limitations in the face of extreme markets.
- Degradation of Capital Efficiency (Opportunity Cost): Because a massive 'Cash Pool' must be tied up to defend against drops, the overall account return can lag significantly behind a simple 1x long-term hold in a secular bull market.
- Cash Out in a Long-Term Secular Bear Market: If a bear market stretches on too long like in 2022, there is a risk that the cash bullets (e.g., 40 divisions) acting as a shield will all run out. Once the shield is broken, you are fully exposed to the unique volatility drag of a 3x leverage.
- Generation of Taxes and Fees: Because profits are continuously realized (sold) upon reaching the target, the 22% capital gains tax on profits and frequent trading fees inevitably occur, gnawing away at some of the long-term returns.
Then, is there a realistic alternative that solves all the drawbacks of these practical methods—'massive idle cash', 'cash depletion', and 'taxes and fees'—while maximizing long-term compounding?
6. Value Averaging (VA): The Positive Compound Snowball and Volatility Harvesting
The answer to overcoming all these drawbacks paradoxically hides in the purest original form of 'Value Averaging (VA)', the academic predecessor of La-O-Er VR, invented by former Harvard Business School professor Michael E. Edleson in 1988.
The core of VA is "forcing your account's 'Target Value' to grow at a constant rate." When the market crashes, you pour in a huge amount of cash more than usual, and when it skyrockets, you don't buy stocks or sell them. If the phenomenon where money melts away when a leveraged ETF encounters volatility is called 'Volatility Drag' in economics, VA inversely utilizes volatility to create additional returns by buying heavily when it's cheap and not buying when it's expensive. In academia, this is called 'Volatility Harvesting' or the Shannon's Demon effect.
[Backtest] Comparison of 3 Strategies Based on Continuous Cash Flow (Actual TQQQ Data)
To prove the magic of VA's 'Volatility Harvesting', instead of the traditional lump-sum deposit, we back-tested a 'realistic installment investment that increases the target by 100,000 KRW (approx. 2 million KRW/month) every day' over 1,200 days (Oct '21 ~ Jul '26).
- Conditions: Initial capital of 10M KRW TQQQ purchase. Target increases by 100,000 KRW daily.
- ① DCA (Dollar Cost Averaging): Mechanical additional purchase of 100,000 KRW daily regardless of market fluctuations.
- ② VA (Allow Selling): If the valuation is below the target, hard cash is poured in to buy; if it exceeds the target, stocks are sold to withdraw cash (profit).
- ③ VA (No Sell): To fully enjoy bull markets, it is left alone (Buy & Hold) when exceeded, and bought only when below.
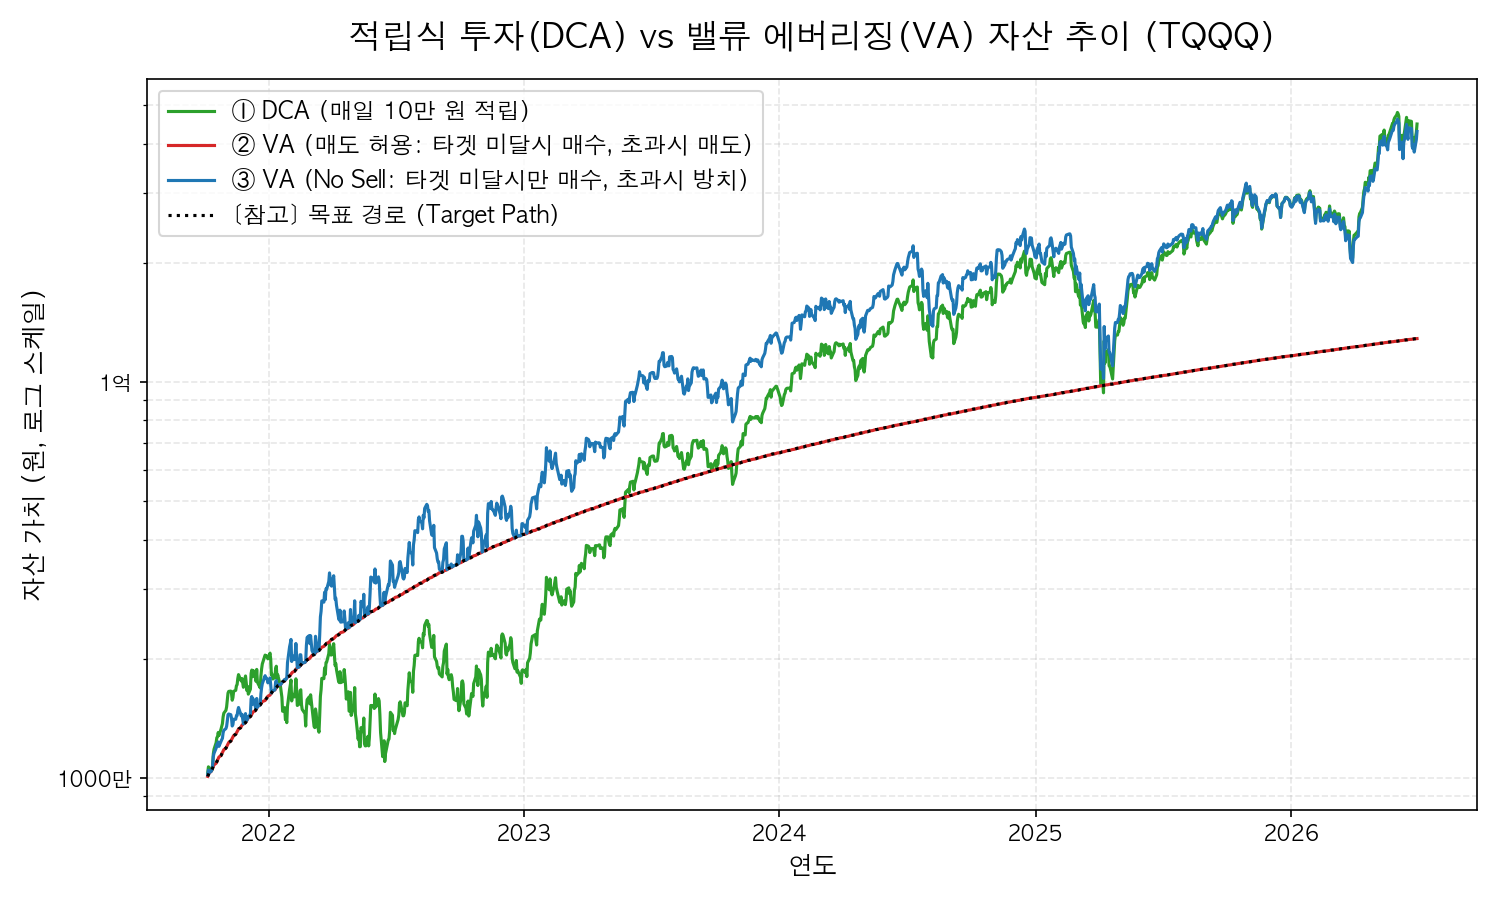
[Table] Summary of Simulation Results (Based on 1,200 Trading Days)
| Investment Strategy | Starting Amount | Added Amount | Total Invested Amount | Final Amount | Profit | Return on Investment (ROI) |
|---|---|---|---|---|---|---|
| ① DCA (100K KRW/day accumulated) | 10M KRW | Approx. 118.70M KRW | Approx. 128.70M KRW | Approx. 448.00M KRW | +319.30M KRW | +248.1% |
| ② VA (with Selling) | 10M KRW | Approx. -90.68M KRW | Approx. -80.68M KRW (Net Recovery) | Approx. 128.70M KRW | +209.38M KRW | Infinite (Principal Recovered) |
| ③ VA (No Sell) | 10M KRW | Approx. 66.01M KRW | Approx. 76.01M KRW | Approx. 429.09M KRW | +353.08M KRW | +464.5% |
Result Interpretation: Cash Flow and Tax Timing in This Simulation
- VA Allow Selling (②): In this simulation, selling amounts above the target produced about 80 million KRW of net withdrawals. A real account would differ because of taxes, fees, slippage, and the timing of each sale.
- VA No Sell (③): With no sales during the test period, taxes and transaction costs associated with selling were deferred, and the ending value was about 429 million KRW. It reached a similar ending value to DCA with less total capital contributed (76.01 million KRW), but the result depends on this price path and target rule and is not assured in another period.
7. The Practical Strategy for Individual Investors Overcoming Leverage Limits
In fact, 'Volatility Harvesting (the technique of making money by utilizing price fluctuations),' the core principle of Value Averaging (VA), is a powerful weapon already widely used in massive capital markets. Hedge Funds, which manage tens of trillions of won, mechanically harvest volatility to create returns through Delta Hedging or Volatility Risk Premium (VRP) strategies. Gigantic pension funds like the Norwegian Sovereign Wealth Fund (GPFG) or CalPERS (California Public Employees' Retirement System) also use strictly calculated 'Target Weight Rebalancing' to sweep up assets cheaply in crashes and mechanically reduce weights in booms, converting the market's extreme volatility into long-term compound returns.
While institutions wield this technique with massive capital and complex financial engineering, individual investors have a much more intuitive and powerful weapon that can be used without complex financial knowledge. That is the 'never-drying salary (cash flow)' with no worries of loan repayment pressure or fund redemptions.
The Mathematical Principle of How Salary Investing Detoxifies the Poison of Leverage
As emphasized in other articles, investing a fixed amount every month through Dollar Cost Averaging (DCA) or the Korean Cost Averaging (KCA) strategy is an excellent shield to survive the extreme volatility of leverage.
Mathematically, when you put a lump sum into a leveraged ETF and leave it (lump-sum investing), the Compound Annual Growth Rate (CAGR) you obtain is calculated with the following formula.
text(L = Leverage Multiple, μ = Underlying Asset Return, σ² = Volatility) L² × σ² CAGR_L ≈ L × μ - ─────── 2
This formula might look complex, but its meaning is very simple. It means that the more severely the market violently fluctuates up and down (increase in volatility σ²), your account gets severely chipped away by the square of the leverage multiple (L²). This is because leveraged ETFs are forced to execute inefficient trading every day—blindly buying more when prices are high and tearfully selling when prices crash—due to their structure.
However, if you do installment investing (DCA) by injecting a constant amount (salary) every month, magic happens. It's the principle that when apples are 10,000 won you buy only 1, but when they crash to 1,000 won you sweep up 10 of them. In mathematics, mechanically buying a much larger quantity in a cheap zone like this is called the 'Harmonic Mean'.
Fixed contributions buy more units when prices are low and fewer when prices are high. That alone does not prove that installment investing must beat lump-sum investing. A sustained rising market may favor investing earlier, while leveraged products can magnify losses through volatility drag and deep drawdowns.
- A person who invested a lump sum (Lump Sum): If the stock price violently fluctuates and barely returns to its initial price, the return rate becomes negative due to the leverage penalty.
- A person who bought in slices with a monthly salary (Installment): Continuing to buy through a decline can lower the average purchase price. The final result still depends on the price path, costs, and whether contributions continue.
In other words, while the leveraged ETF itself 'eats away at profits' due to volatility, our salary investing utilizes that exact same volatility to 'massively slash my purchase price', thereby structurally and excellently offsetting the drawback. It is a mathematical harmony where the vicious trajectory inside the leverage is covered up by the opposite force of my salary's 'massive buying at the bottom'.
However, just because the math is perfect doesn't mean the investor always wins. The true terror of leveraged investing is not volatility drag, but the 'Psychological Collapse (MDD)' an investor experiences when their account hits -80%. No matter how great a strategy is, if you panic sell all your stocks at the bottom out of fear, the math of the Harmonic Mean doesn't work.
Furthermore, when a market crash (economic crisis) occurs, there is a high risk that an individual's cash flow, such as job loss or income reduction, will also be cut off. Therefore, before blindly trusting salary investing, safely depositing a minimum emergency fund in short-term bonds or a parking account, completely separated from your stock account, is an essential prerequisite for long-term investing.
Practical Investment Methods
In conclusion, I have tested various leveraged ETF trading methods directly in my account by carving out a portion of my assets (satellite portfolio). The clear lesson I gained from that result is 'if you simply buy and leave a leveraged ETF without trading, the account melts away.'
Installment investing (DCA) is one way to spread entry points without forecasting the market. The VA with selling approach described above may be an alternative for an investor able to supply additional cash and tolerate deep losses, but it does not remove leverage risk, taxes, or costs.
A 2x product can still magnify losses and volatility substantially and should not be treated as a default for long-term investors. Before choosing any multiple, review the prospectus, daily-reset structure, historical drawdowns, the possibility of interrupted cash flow, and whether the position is limited to a tolerable size.
Even in the fear of a collapsing market, trust that your salary will mechanically sweep up shares at a cheap price. Choosing a volatility you can handle, maintaining your trajectory with meticulous salary investing, and moving forward without wavering. This is the core of 'Stay the course' for individual investors to survive and grab wealth in a complex and brutal market.
💡 Practical VA (Value Averaging) No-Sell Guide for Beginner Office Workers If you have a fixed surplus salary to invest every month, try setting a 'Target account amount to increase every month' according to your situation.
- For Beginners: Grow the account size by 400,000 KRW every month (approx. 20,000 KRW/day)
- For Intermediate: Grow the account size by 1M KRW every month (approx. 50,000 KRW/day)
- For Aggressive Investors: Grow the account size by 2M KRW every month (approx. 100,000 KRW/day)
Core Rule: Choose a convenient date (daily, weekly, or monthly) to check your account. If the stock price drops and you are short of your target account amount, simply transfer exactly that shortfall amount from your salary to fill the target.
- [IMPORTANT] Max Input Cap (Max CAP): If a crash market prolongs and the amount you need to fill becomes too large, never take on debt unreasonably. Set your targeted monthly surplus salary (e.g., 1 million KRW) as the Max CAP, invest only up to that limit, and carry over the shortfall amount to the next month.
Conversely, what if the stock price rises and exceeds the target amount? Never sell (No-Sell), take a break from investing that month, and use the remaining cash to buy a 1x Market ETF or Bond ETF. (This serves as a solid bullet stockpile for the next crash and creates stable returns)
Recommended Assets: We recommend leverage based on 'Market Representative Indices' proven to historically trend upwards.
- S&P 500 (500 US Blue Chips): SSO (2x), UPRO (3x)
- Nasdaq 100 (100 US Tech Stocks): QLD (2x), TQQQ (3x)
- Others: KOSPI index tracking leverage, etc.
- Warning: Products that invest only in specific industries like semiconductors (SOXL) have too large of an up-and-down swing, making it difficult for beginners to endure. We strongly recommend gaining enough experience first with market representative indices.